top of page

Creator

Ticketransparency

UM OARS

Landscape
UI/UX Researecher and Designer
Creator Platform
A platform for video creators to analysis video back-end data, manage sponsor's tasks and connect to sponsors.

Duration
Teammates
Sep. 2022 - Dec. 2022
Yaqi L. Isha Aditi
My Role
Tools
UI/UX Designer and Reseacher
Figma Miro Illustrator
Research
Problems
Short video creators can't do data analysis and project management on one platform.
As a user experience researcher and designer, I started thinking about how we can create a comprehensive platform for influencers to manage their sponsors, collaborators, and data analytics with a smooth user experience for everyone.
User Interview
We designed questions in the user interview session to understand user pain points and needs.
We interviewed a wide range of video creators, from entry-level to professionals with over a million followers.
User Persona
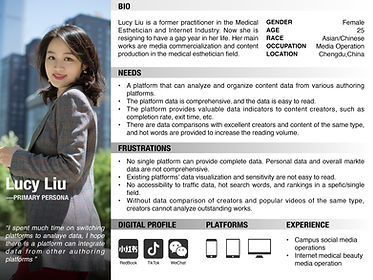
Primary Persona
Secondary Persona

Narrative Storyboard
Difficulty in filtering out the message and poor accessibility to sponsors are also user pain points.


Design
Ideation
Through the analysis of user interviews, we came to the following conclusions.
-
Data analytics are very important for the target audience.
-
The idea of interaction and data sharing with fellow video creators was very well received.
-
The accessibility to commercial resources (Sponsors and Product endorsement) and sponsor management is of main concern to the interviewee.
Design Feature
Home Page Dashboard
The recent data analysis videos are present at the top of the interface in the form of cards to help users access them quickly. Users can also access specific platforms for data analysis and compare data with creators of the same genre. At the bottom of the interface are the tasks posted by sponsors.


Talk to Sponsors and Creators
Creators can explore and contact potential sponsors, while managing messages from unfamiliar users, creator messages and sponsor messages separately.
Visualize Backend data
Import video content from multiple creation platforms. Visualize data and provide core metrics for video creators' data analysis. Provide better user experience interacting with content video data analysis


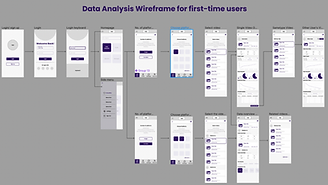
Userflow Diagram
This procedure aided in the organization of the screens and the division of what features went where and in what order.

Paper Prototype
We were able to visualize our concept better by creating paper prototypes. Feedback at this level suggested some changes to the navigation bar, which was later incorporated into the lo-fi prototype.


Low-Fidelity Prototype & Usability Testing
Usability testing was made easy as participants could walk through the application themselves and answer some of our pressing concerns.


Final Design
Creator
Ticketransparency
UM OARS
Landscape
bottom of page